Back to blog
Everything you need to know about Google Analytics 4

Get ready for Google Analytics 4! The new tool designed to track users’ behavior was introduced in 2020 and is here to stay.
On July 1, 2023, we will say “Goodbye” to the good, old Universal Analytics that we all know and have grown to love. So, grab your pen or start typing – take notes on what Google Analytics 4 has in store for you.
Google Analytics 4 highlights
We will explain how Universal Analytics differs from the new version in the way the data is structured, collected, and reported. For those who already miss the currently used iteration and fear the steep learning curve – it’s important to understand that Google Analytics 4 is a powerful tool that comes equipped with new capabilities. The following stand out the most:
- focus on the complete relationship with users
- use of machine learning model for predictive analysis of visitor behavior
- support for more effective marketing campaigns
- cross-device and cross-platform tracking of customer’s journey
- application of the “privacy-first” principle
- possibility to target and personalize Google ads
We will address all these aspects in the article.
What is Google Analytics 4?
Google Analytics 4 (GA4) is the next generation of web analytics platforms and the latest version of Google’s famous online marketing tool used to track visitors’ activity. Introduced in October of 2020, GA4 has been causing quite a stir in the online world in the past months. Why? Because it’s not a simple redesign or update of commonly used Universal Analytics.
Instead, it should be treated as a new product, created with new goals in mind and based on models different from those applied in its previous versions. In short, Google Analytics 4 was set up to respond to a growing market of mobile applications and a need for a more comprehensive analysis of the single user journey. Let’s check how data collection and measurement are done with GA4.
How did we get there? A brief story of the Google Analytics evolution
Not many people remember, but Google Analytics was introduced already in 2005. The third iteration, known as Universal Analytics, has been in use since 2013. It offers plenty of valuable insights and features, such as real-time reports, user-id tracking, and multi-channel funnels. It has had a good run, and it was undoubtedly a capable tool.
With time, however, the digital world expanded, individuals started consuming massive amounts of data on multiple devices, and, consequently, the customer journey has gotten complex.
Suddenly, basic traffic movements and bounce rate measurements have proven insufficient for customer behavior analysis – what people wanted to see was the overview of all user interactions with an app or a website in one place. And that is what GA4 property gives them. Initially named “App + Web properties,” the tool allows measuring data collected from connected websites and mobile apps and viewing them in one panel.
Moreover, GA4 introduces an analytics model based on the collection of data linked to the entire user’s journey rather than page visits (sessions). It’s called an event-based model, and it can be recognized by everyone familiar with Google Analytics for Firebase (GA4F).
GA4 vs. Firebase vs. Universal Analytics
So far, you needed different properties to collect data from various devices – Universal Analytics for web and GA for Firebase to get the insights on mobile app usage data.
GA4 and GA4F are very similar in structure, display, and, primarily, the applied model of data analysis, which is based on a flexible system of “events.” Basically, every user interaction is treated as an individual event (more on that later). Universal Analytics, on the other hand, built the measurements around “sessions” on the website. While the session-based model is not applicable for mobile apps, it was possible to do the opposite and adapt the event-based one to web. That’s why Google applied the GA4F solution to facilitate cross-device and cross-platform analytics.
What is new in Google Analytics 4?
This section will discuss the main differences between Universal Analytics and the new Analytics tool. We’ll look at:
- The structure
- New reporting interface
- Changes in reports in Google Analytics
- Event-based tracking
- Introduction of “engaged sessions”
- Data prediction with AI machine learning
- Integration with BigQuery
Let’s dive right into it.
The hierarchy of the new Google Analytics account
GA4 account is made of one or more properties (they are the equivalent of “projects” in Google for Firebase). Each of them has one reporting view made up of several reports. Every Google Analytics 4 property is populated by information from web or app data streams (sources). App data streams can be further divided into iOS and Android. Usually, GA4 has one property for each website or user experience. Note that this is different from the domain, because one website can cross multiple domains and subdomains.
If you have a website and a mobile app on both iOS and Android, it means that you will use multiple streams for one property. You must take care of consistent configuration so that the names and parameters in each stream match. It will make the production of clear and understandable reports easier.
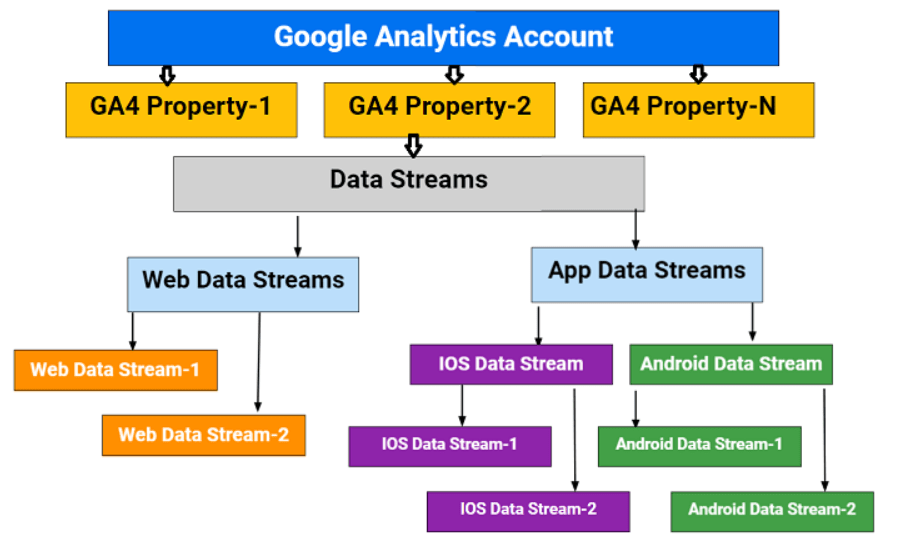
Source: optimizesmart.com
GA4 interface
One of the first things you will notice is that the interface has changed. The new user interface has been rearranged and is organized per user data, event, and customer lifecycle stages: Acquisition, Retention, Engagement, and Monetization.
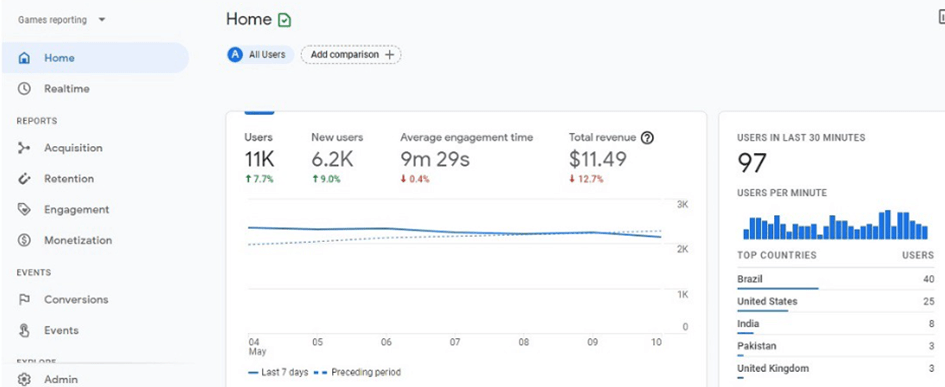
It may take some getting used to, but in comparison to Universal Analytics, the new version is much more intuitive, with limited drill-down options and well-organized reporting.
that you can change
your business.

GA4 reporting
In new Google Analytics, everything the user does on both web and app, is tracked – from loading a page, and scrolling, to button clicks, video engagement, and completing a purchase. Reporting is focused on the user rather than on a single interaction. Of course, it means that it’s a more complex system, which could make reporting more complicated, but in reality, the opposite is true. GA4, unlike Universal Analytics, offers a limited number of standard views and instead focuses on flexible custom reporting.
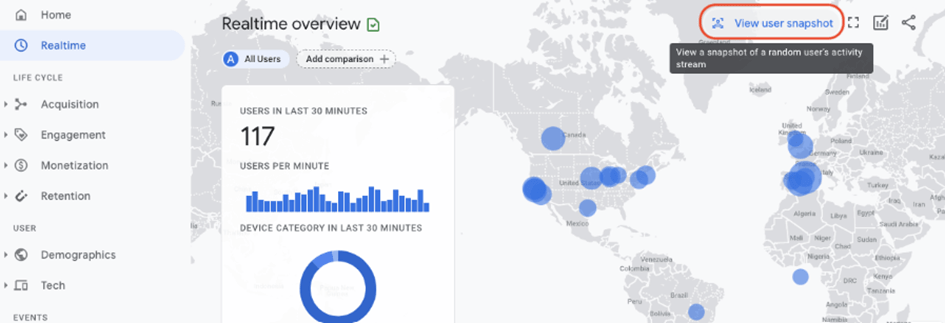
The standard reports monitoring key business metrics are visible when you log in. The home page will show you the summary of the overall website traffic, conversions, and revenue. On the left bar, you will notice the list of available reports. One of them is the Realtime report presenting the events that happened in the past 30 minutes. If you click on View user snapshot, you will be given the information about a single user, including his device, location, and engagement through events.
The Life Cycle reports take you through all the stages of the user lifecycle: acquiring, engaging, monetizing, and retaining users. They mirror the conversion funnel and present the way the visitors enter and behave in it.
However, the most significant change to the GA4 is the Analysis Hub (you can find it under the Explore tab). Previously available only to the users of paid Google Analytics 360, the now-free feature allows you to use advanced analytics to identify key trends regarding user actions on your website. In addition, you can produce different types of reports, including:
Funnel analysis – informs you about the user behavior at different stages of the sales funnel and the steps they take, for example, to complete a purchase. It’s helpful if you want to find out why some visitors turn into repeat customers and others leave before finalizing the purchasing event.
Path analysis – shows the sequence of pages visited by the user and the actions taken. You’re able to find out how visitors move through your website.
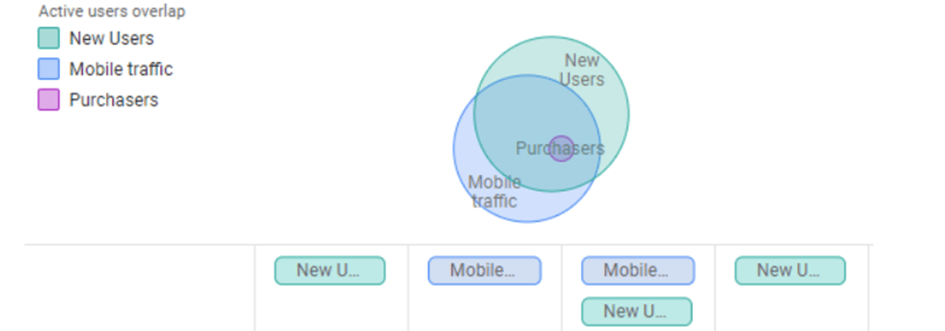
Segment overlap – lets you see how segments relate to each other. A segment could be a group of users that have something in common. For example, they could share a location, visit the same page, use a tablet, or take a specific action on the site (like a purchase).
Cohort analysis – it’s designed to identify demographics based on the device data. In this context, a cohort is a group of people with shared statistics, and the analysis is used to measure how smaller related groups interact with your website.
User lifetime report – shows how the user has been behaving since the first visit to your site. Such knowledge helps plan marketing campaigns targeted to the most valuable users making frequent purchases. You can also check which of your past campaigns secured loyal customers.
Free Form exploration – represents data in a tabular form, with easy to arrange rows, columns, filters, and segments.
Event-based tracking
In GA4, an event is every user’s interaction with a web page element (such as image, button, form, link, scroll bar, etc.), content, or a screen load.
Event tracking is not new to Google Analytics; Universal Analytics already supports it. In the previous version, the basic unit of data collected was called “hit.” The common hit types are pageviews and events (interactions that cannot be tracked as pageviews). Every time you create the event, you have to configure it by including meta information and parameters: category, action, label, and value (the latter two are optional). In Google Analytics 4, some events come preconfigured.
Automatically collected events can be mandatory (including first visit and session start) or optional. The latter are called enhanced measurement events, and they include, for example, outbound clicks, file downloads, or video engagement.
GA4 comes with a choice of recommended events that need to be implemented manually. They must, however, use the name and parameters supplied by Google. But, you are more flexible when it comes to custom events where you’re the one deciding on parameters, which you can set up using Global Site Tag (requires coding) or Google Tag Manager.
Events can be further categorized into the web, app, app+web, or Android events.
Engaged sessions
You are probably used to seeing the “bounce rate” metric, and you could be a bit disappointed with the news that it’s no longer in use in GA4. But that change was made for a good reason. First, “bounce rate” could not work across different platforms. Secondly, it failed to correctly measure engagement on, for example, publishing sites, where single-page sessions do not equal the failure to act. The metric simply cannot differentiate between whether the visitor left the page because he didn’t find anything interesting or whether he did locate the article he liked, read it, and left without any follow-up action.
Instead, Google Analytics 4 presents a set of engagement metrics, including engagement rate and sessions. So now, when you want to define the level of user engagement with your website, you have to calculate the rate as the number of engaged sessions divided by the total number of sessions. An engaged session is the one where a visitor interacts with a site for at least 10 seconds. It’s also recorded when the user views one or more pages or his session triggers at least one conversion event (which is the desired action, such as a purchase, newsletter registration or social media share).
Machine learning and data prediction
Now, this is exciting! Did you know that GA4 can help you foretell future user behavior and even profits? All thanks to machine learning algorithms that predict your data for forecasting purposes. This is excellent news for any e-commerce business: now, it’s much easier to target ads and marketing campaigns to specific segments of users whose behavior you can foresee.
Moreover, as the machine learning model fills in the gaps left by the missing current and historical data, it no longer relies on storing IP addresses and third-party cookies, thus taking user privacy to a whole new level.
Integration with BigQuery
BigQuery, known to the users of Google Analytics 360, is the data warehouse that lets you perform analysis of high volumes of data. It allows for in-depth analyses, going far beyond the reporting interface. And its integration with Google Analytics 4 is entirely free!
So, are there any Cons of GA4?
As mentioned at the beginning of the article, the introduction of GA4 caused quite a commotion. It undoubtedly needs some getting used to. No product, and especially a relatively new one, is flawless. The primary reported disadvantages of the latest GA version are:
- Challenging adaptation to the new environment (new property structure, different menu architecture, and navigation)
- Different analytics and marketing tags than in Universal Analytics
- Time-consuming setup and configuration
- The loss of historical data from the old version (you can’t simply move it from Universal Analytics)
- Limited e-commerce data in the reporting view
Do you have to switch to Google Analytics 4?
The thing is – you don’t have a choice. The question is not “If”, but “How soon?” you have to do it. From July 1, 2023, Universal Analytics properties will stop processing new hits. After that, you will be able to access your previously processed data for at least six months. However, it won’t be available forever. Sooner or later, Google will disable Universal Analytics properties altogether.
We’ve already mentioned that you cannot simply move historical data between different versions. Data is collected only from the moment you create new properties, so the sooner you set up the GA4 account, the more history you generate (and the more time you have to practice).
What you can do, however, is to use Universal Analytics alongside Google Analytics 4. The analytics data will be then sent to both tools. This is called Dual Tagging and will allow you to compare reports.
GA4 is the future of web and app analytics – let’s welcome it together.
Similar posts:


What can we do for you?
Talk to us about your project and let's start building it together!